
Last August, just minutes from Lego Land, we gave a talk titled 'Call Me "Maybe"'. It was an updated version of a talk originally given in 2012 - when Carly Rae Jepsen was topping the Billboard charts and the reference was a bit more timely. But the content was just as important as it was 13 years earlier: forecasting is more effective when you embrace uncertainty.
The "maybe" is the whole point. A real forecast doesn't hand a clean yes or no, it gives you both a range and an honest accounting of where that range might miss.
It's been a year, so in the interest of transparency we decided to see how we did.
What we were actually forecasting
"Sales tax" hides a lot of moving parts, so a quick refresher. We forecast quarterly Bradley-Burns local collections across the ten Southern California counties — Imperial and Kern up through LA, Orange, Riverside, San Bernardino, San Diego, and the coastal three. It's a big, noisy number, and it can be impacted by ports, gas prices, building permits, unemployment, the S&P, and roughly a thousand other things.
That's exactly why we forecast it the way we do. We can't know exactly what to expect, but we can be reasonably confident in the range of outcomes. Instead of predicting the exact value, we quantify your uncertainty instead. Every credible forecaster eventually arrives at some version of Churchill's line about democracy: probabilistic forecasting is the worst way to see the future, except for all the other ways that have been tried.
We built two models that work in very different ways:
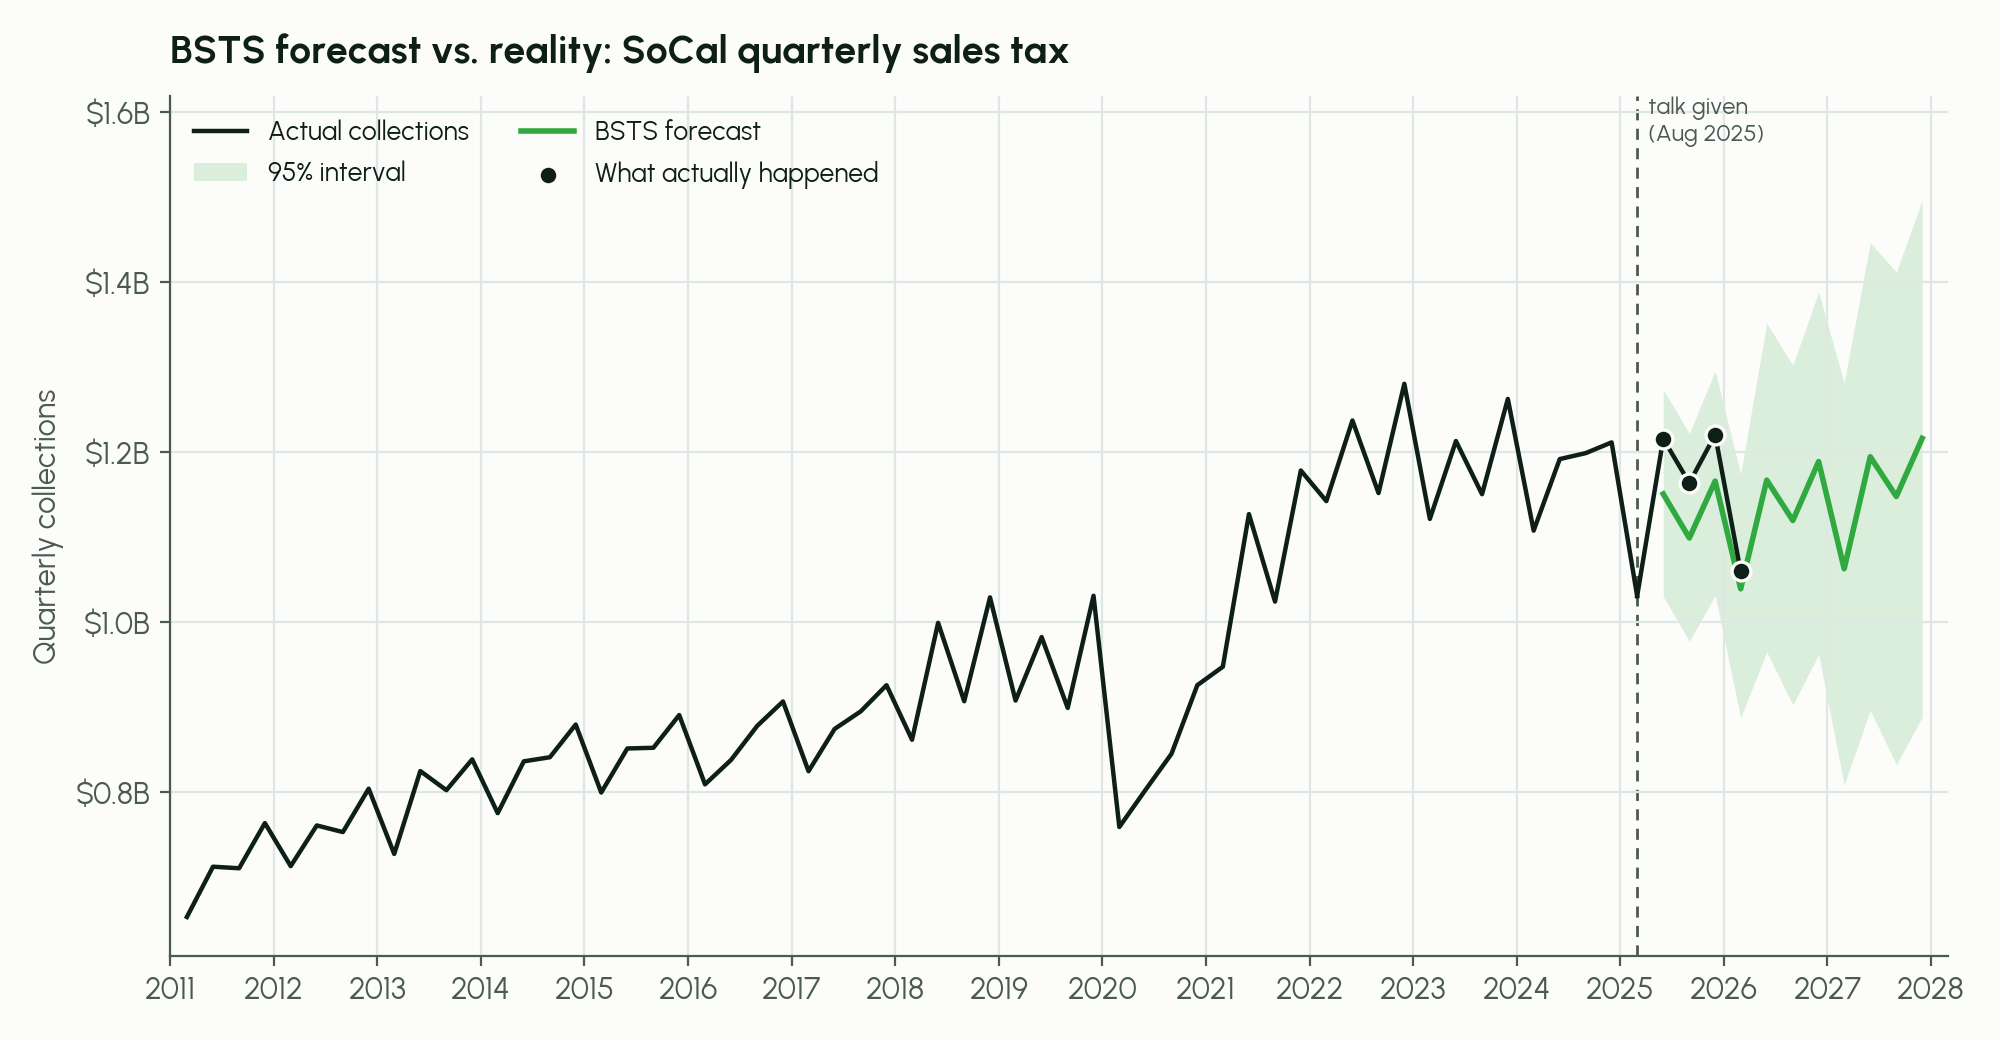
- Bayesian Structural Time Series (BSTS) models break history into trend, seasonality, and noise. Then we can layer in what we already believe about how the economy behaves. Each quarter builds on the last, and its range fans out wider the further you look: an honest admission that next quarter is easier to call than eight quarters out.
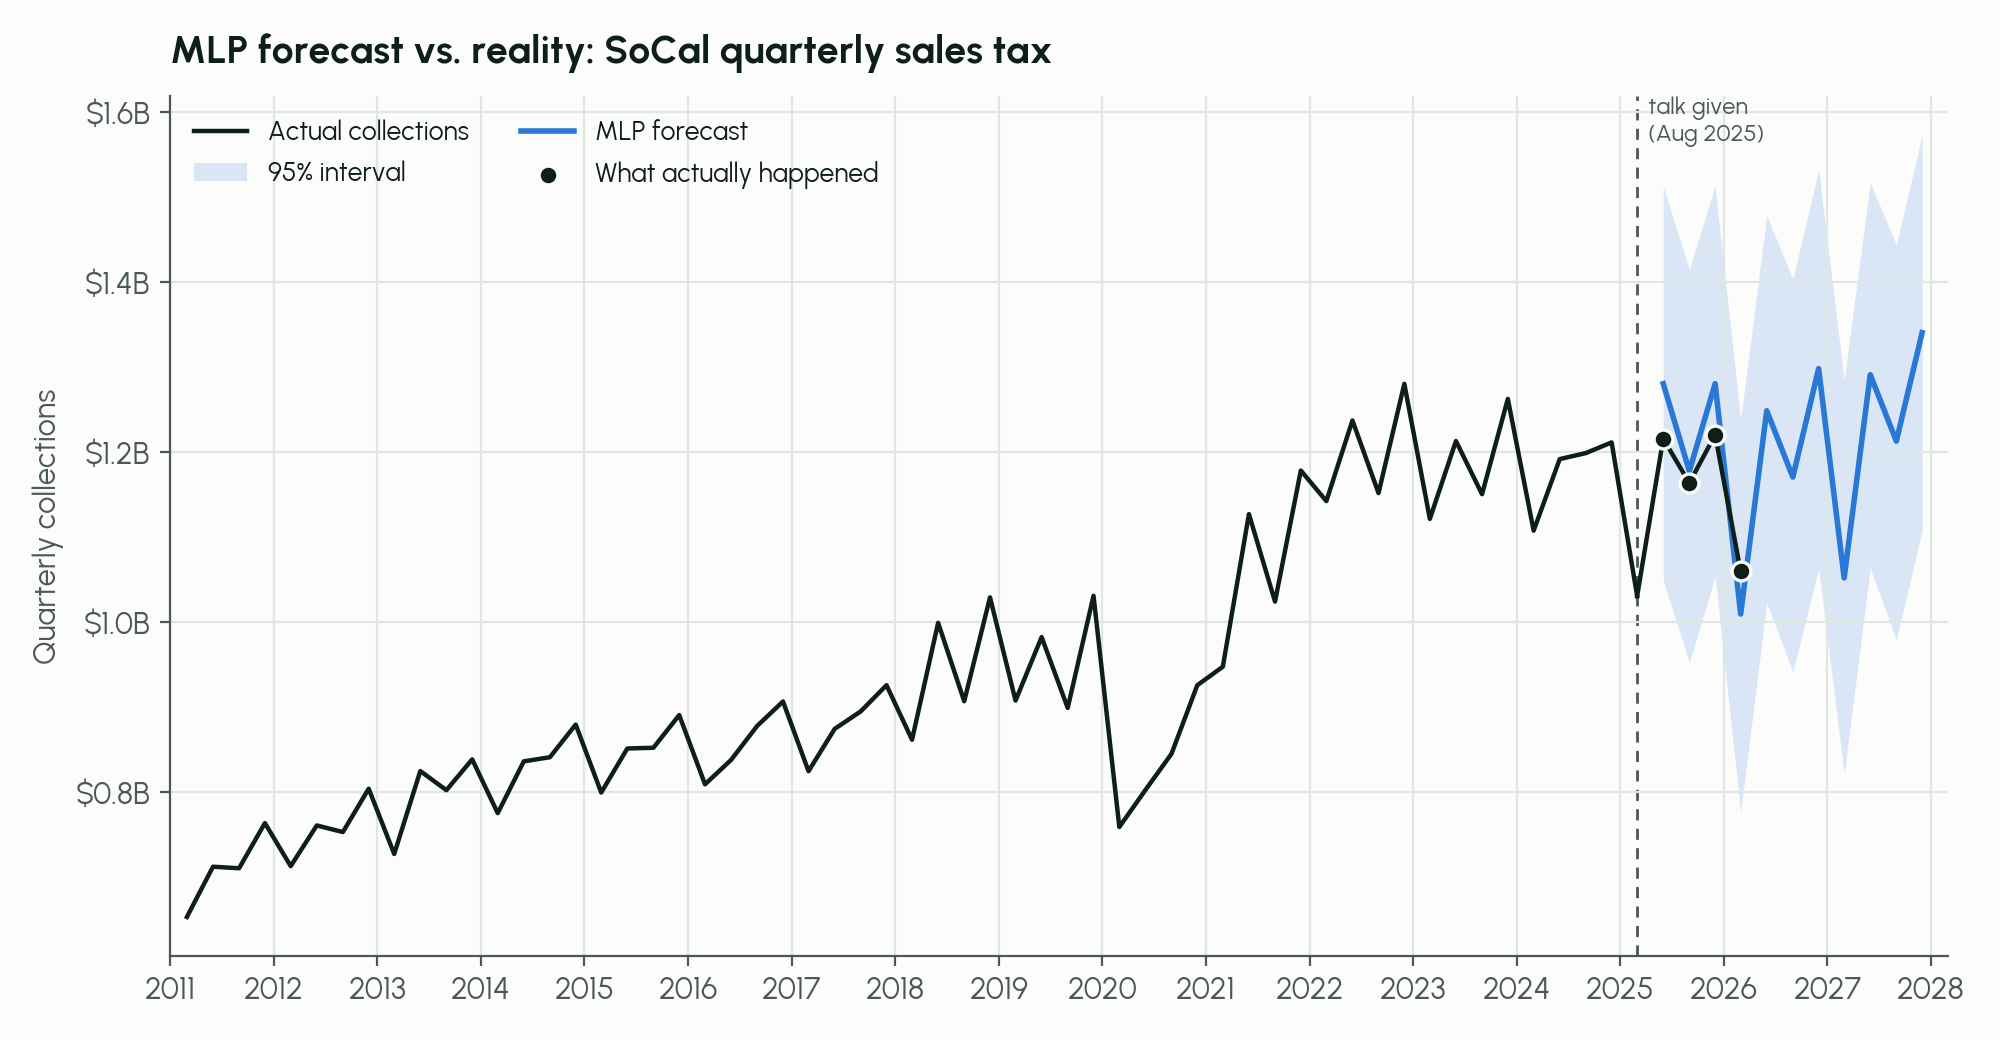
- Multi-Layer Perceptron (MLP) is a small neural network. It doesn't bother with decomposing your historical data; instead, it learns patterns from the features by brute force. Its predictions are more or less to independent from quarter to quarter, so its uncertainty band stays roughly the same width the whole way out.
Two different models will often disagree in interesting ways, even when given the same problem. Ours did just that, providing us with valuable information moving forward.
What actually happened
Reality told a fairly mundane story. Sales tax came in flat-to-modestly-up: roughly 2.0% growth year over year in 2025 Q2, a modest decline of 2.9% in Q3, up 0.7% in Q4, and up 2.8% into 2026 Q1. No boom, no cliff, just a reasonably stable - if slow - growth rate.
Here's a comparison of both models along with the actual collections that occurred (in black):
The Box Score
Numbers rarely speak for themselves, so here they are with the interpretation attached:
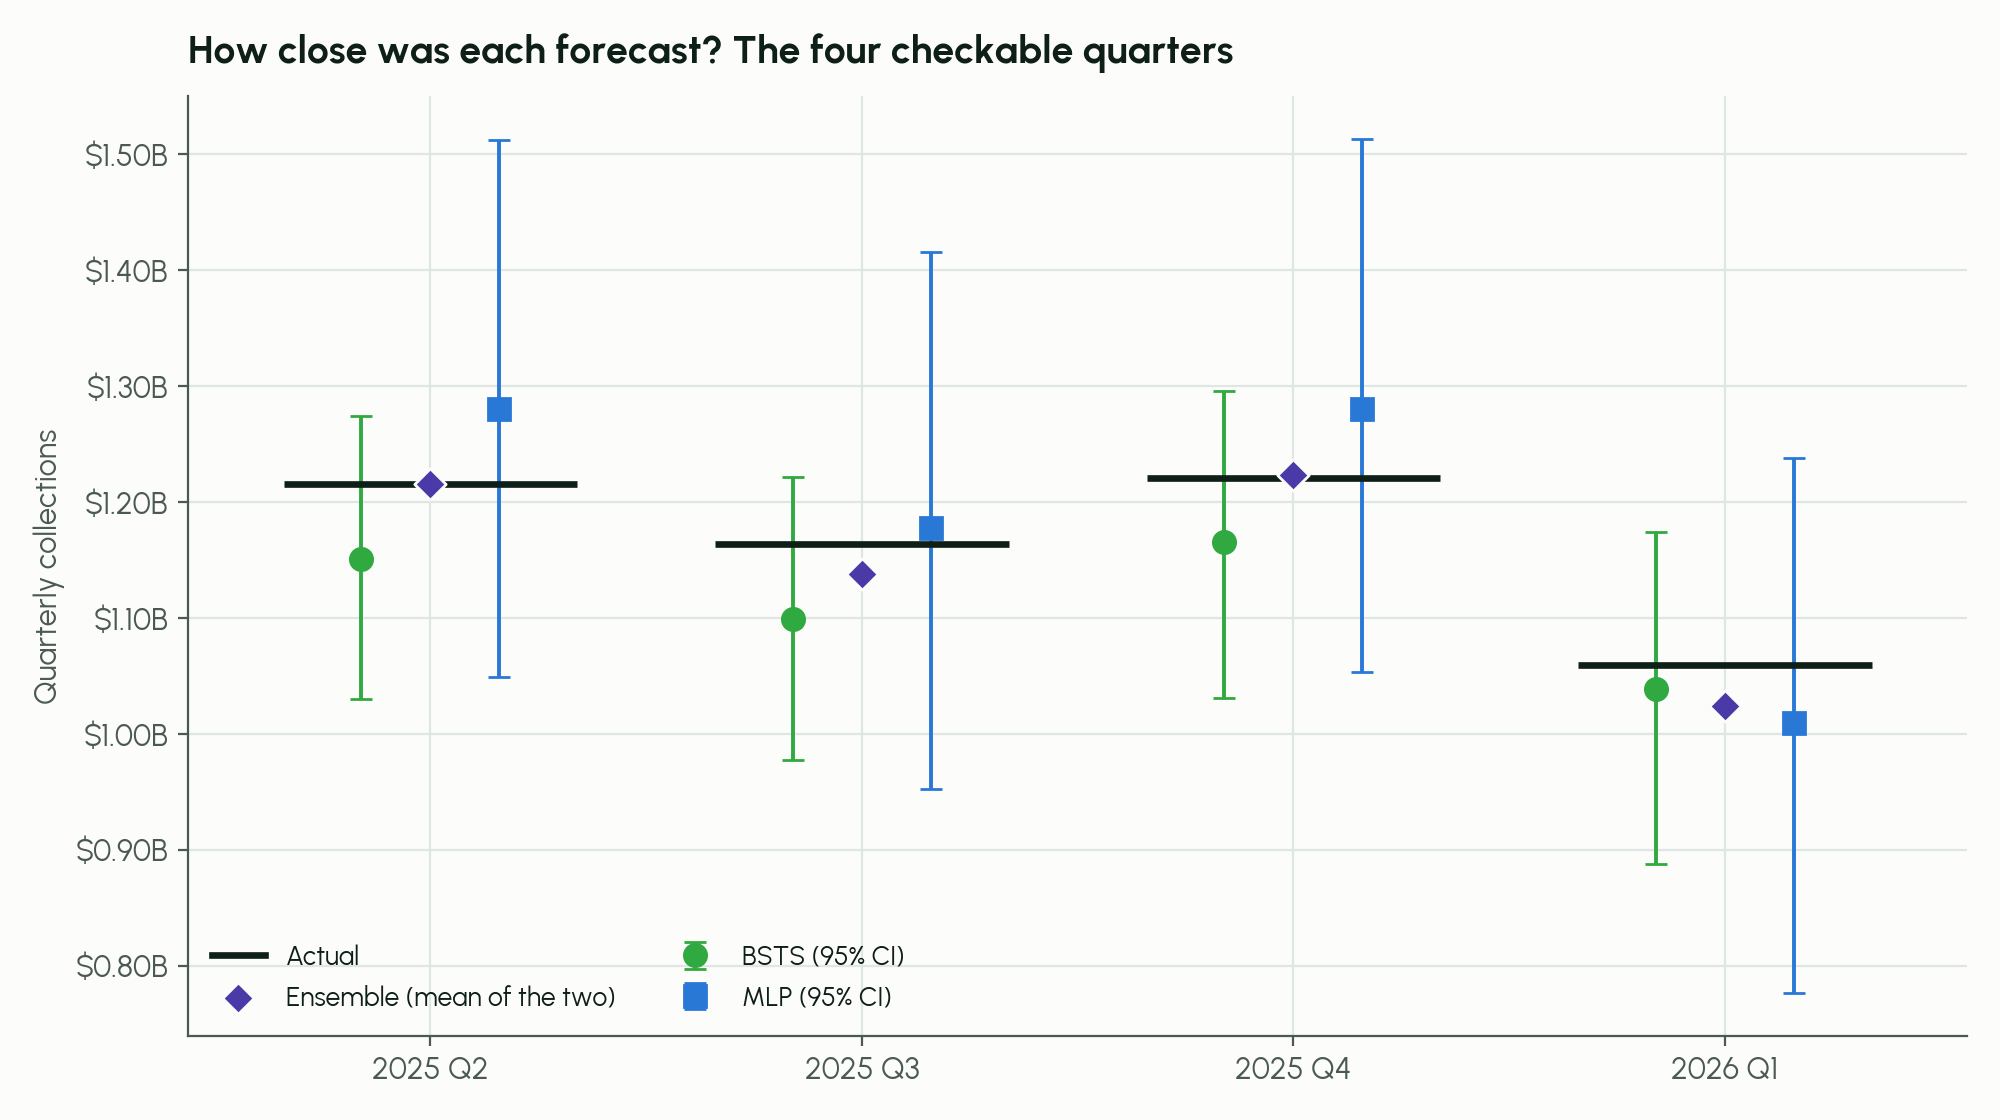
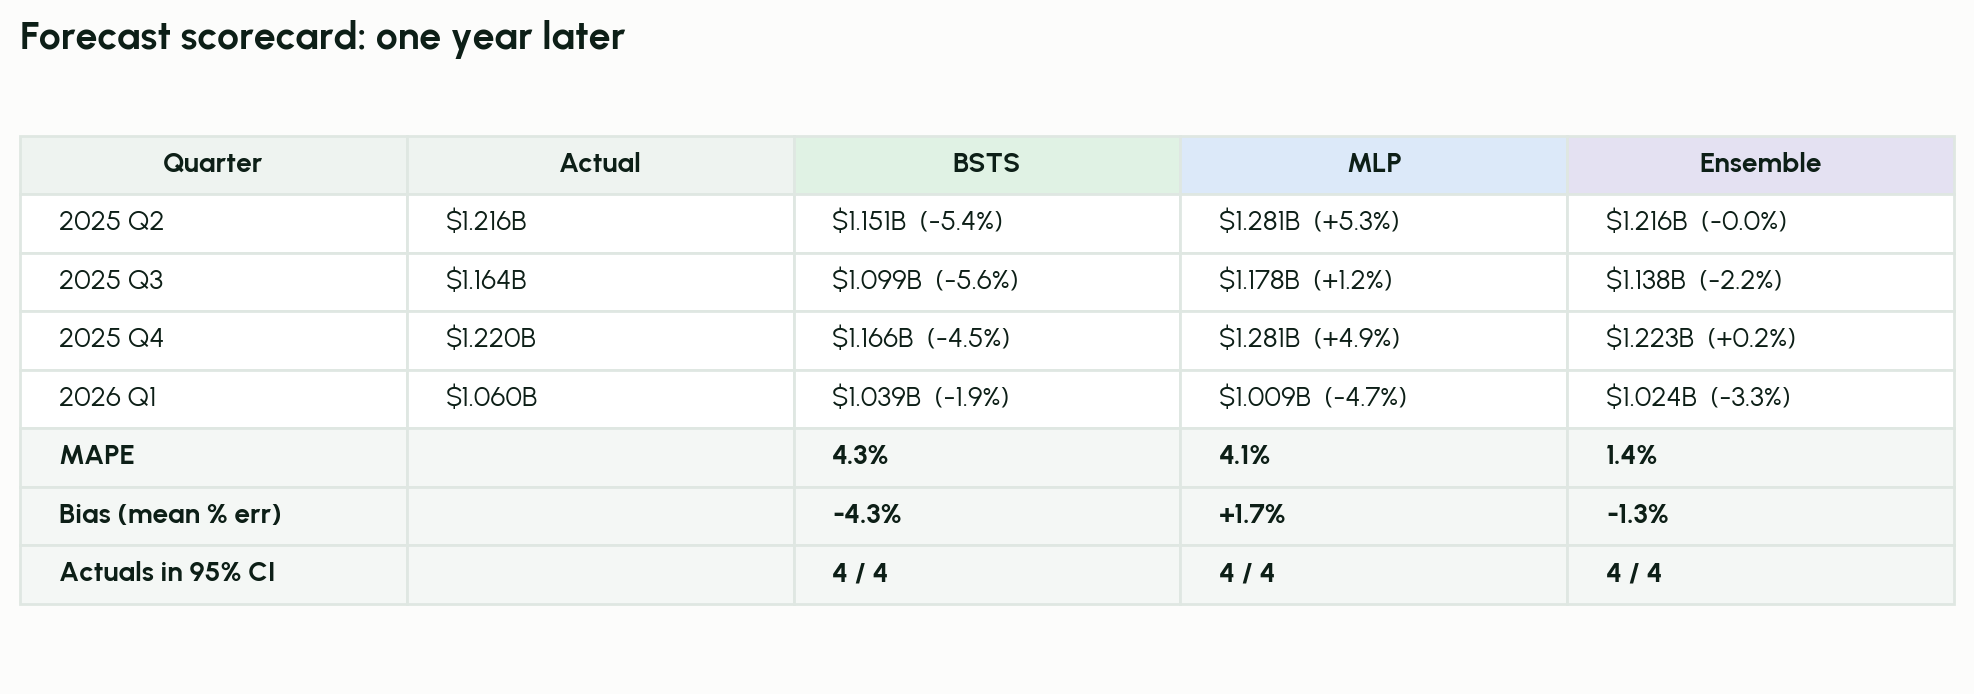
Both models kept reality in the ballpark: every one of the four quarters landed inside both 95% intervals. That's the goal for a probabilistic forecast. The promise is never "we'll hit this number," it's "reality will fall in this range, and here's how wide that range needs to be."
BSTS was consistently too cautious, missing low every quarter by an average of 4.3%. Fortunately, this consistency shows us that we're dealing with a model bias rather than random error.
MLP was the better single guess, but it was streakier. On average, it missed by about the same (4.1%) but it scattered on both sides of reality instead of leaning in one direction. As a result, the bias was much smaller.
The reason for this difference is clear when you look at the historical data. Post-COVID, sales tax trends in Southern California have seen a noticeable trend-shift. This is something we called out at the time, and that trend looks pretty consistent over the intervening time.
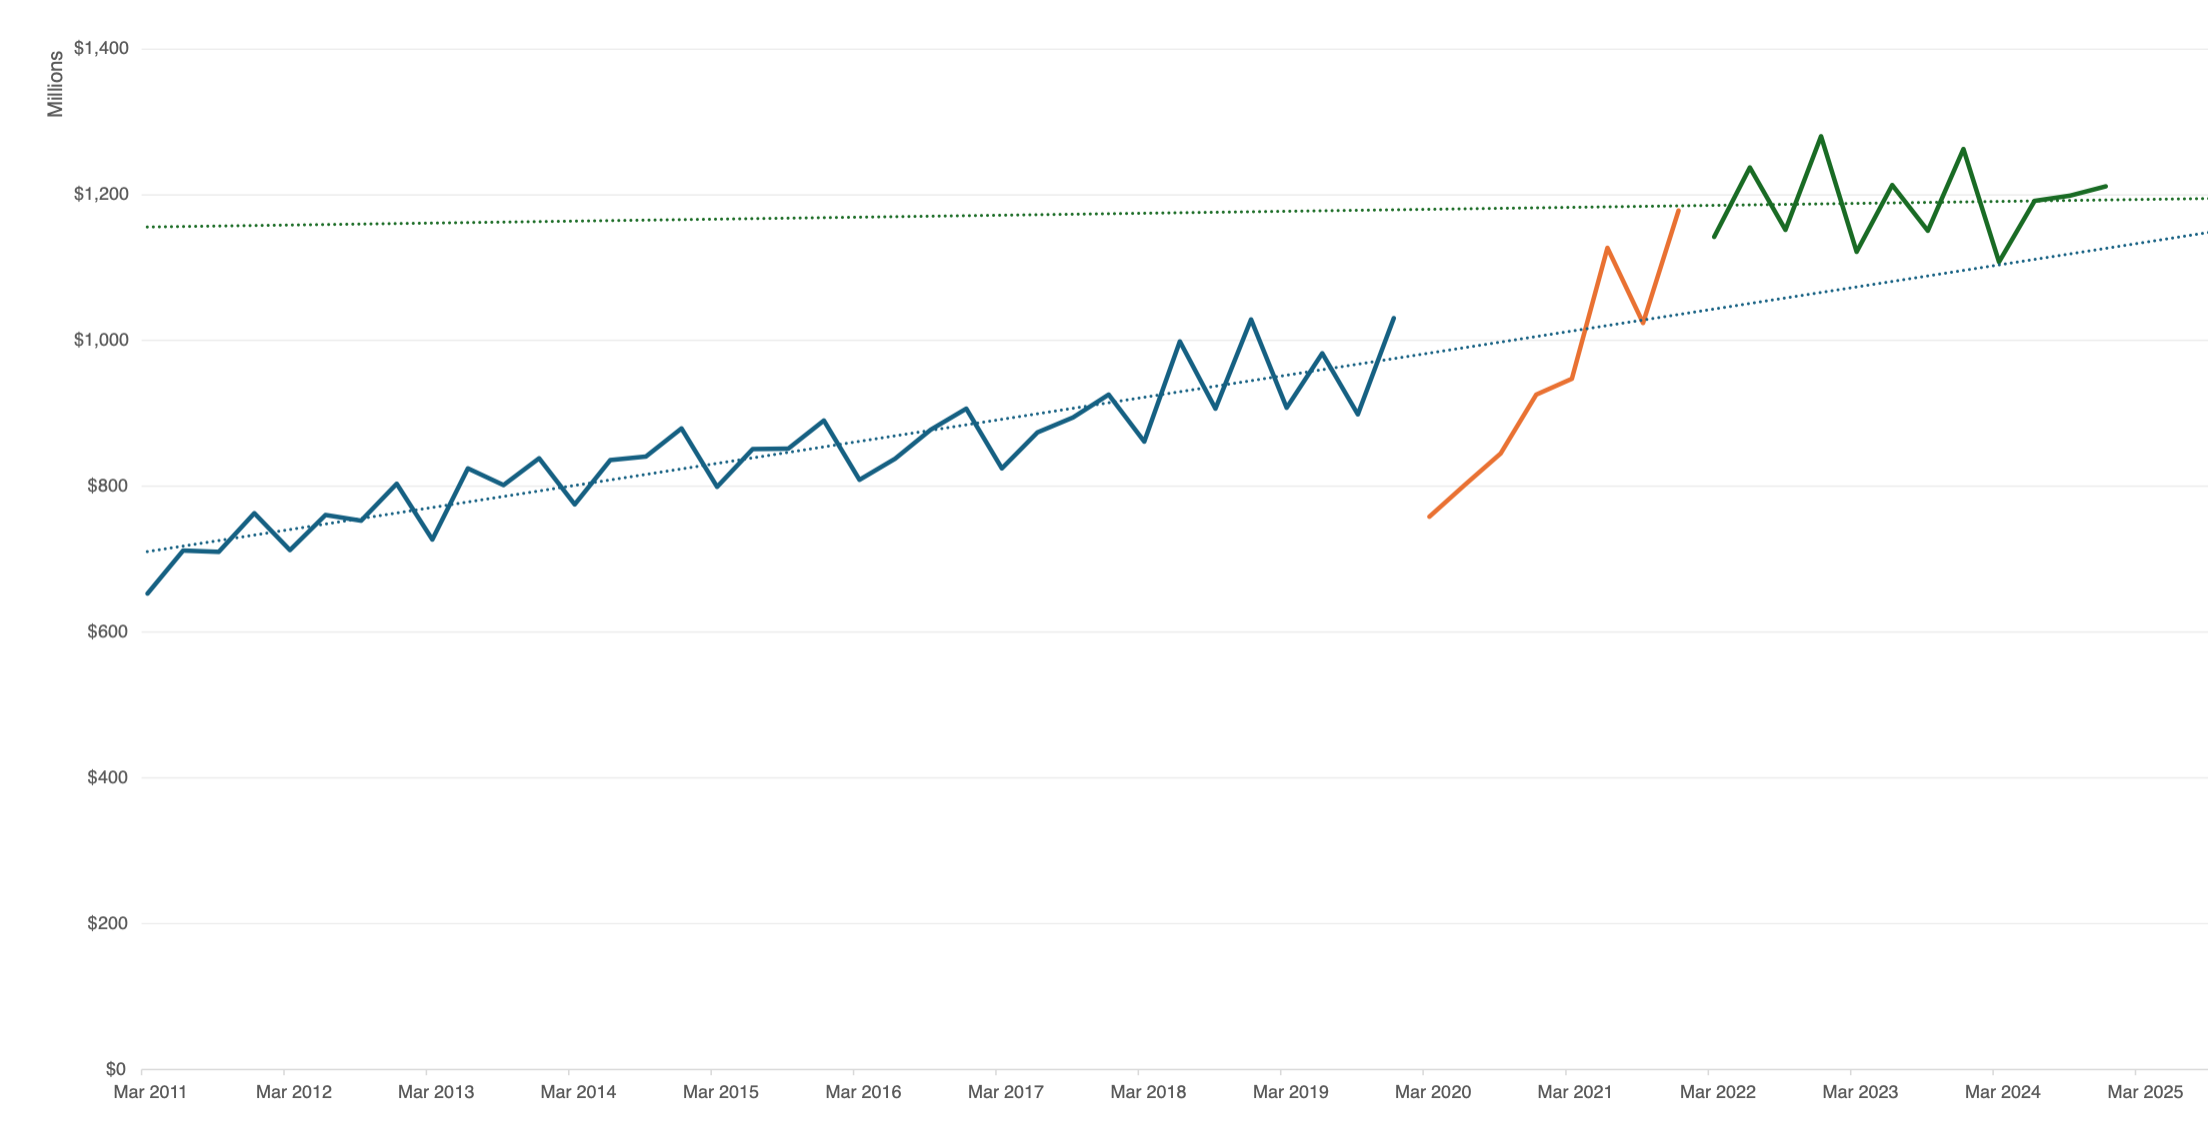
The BSTS model placed more emphasis on the new trend, while the MLP model gave it less weight.
If you had to pick one model's point forecast for your budget, MLP was the one to trust this round — with a catch worth naming: it landed on the high side, and trusting its median would have meant overshooting actual collections. Budgeting to revenue that never shows up gets you a mid-year shortfall. Erring low the way BSTS did just leaves you pleasantly surprised. MLP bought its accuracy with a much wider uncertainty band, and that's the trade-off in a sentence: there are no grand solutions here, only trade-offs.
What we chose not to do, but should have
In the talk, we suggested that combining models like these into an ensemble would probably be a better approach.
We didn't do that for today's talk but you certainly could.
We should have.
In simple terms, an ensemble model is just a combination of two or more models. You can average the values or give them each different weights. It works for the same reason a room full of independent, half-decent guesses tends to cancel out its own errors: the people who are wrong are usually wrong in different directions. BSTS leaned low, MLP leaned high. Split the difference and the two mistakes mostly disappear.
So here's the ensemble I described on stage but never actually drew:
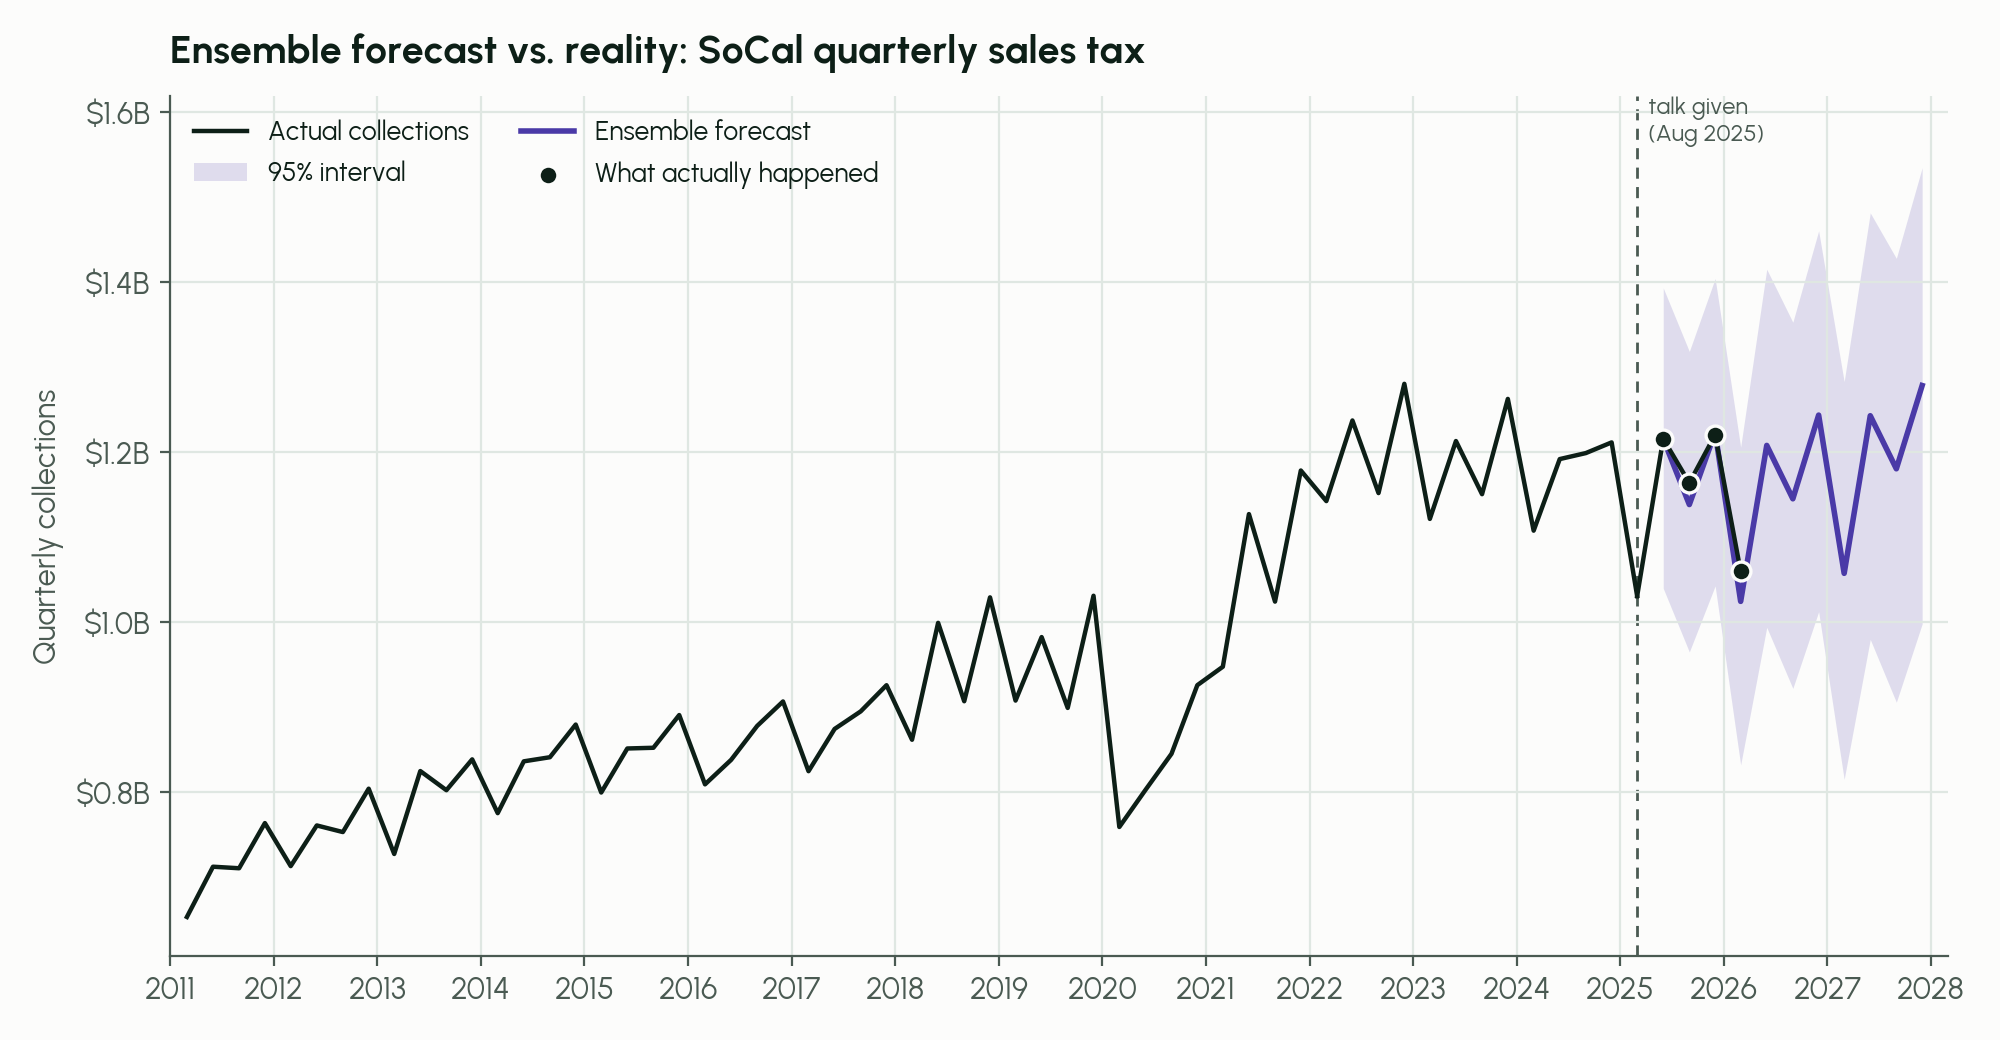
The easiest approach (just averaging the two point forecasts) would have posted a 1.4% mean absolute percentage error (MAPE), roughly a third of either model's error alone. In two of the four quarters it landed within a rounding error of the actual number.
Takeaways
You don't need to build a neural network to take something home from this.
- The range is the product. When we brief a council, the single number gets all the attention and carries almost none of the value. "Sales tax will be $1.2 billion" is a claim you will be wrong about. "Sales tax will very likely land between X and Y, and here's where the downside risk lives" is a claim you can actually manage against.
- A forecast you never grade is a vibe, not a forecast. The only reason I can write any of this is that we wrote the numbers down, dated them, and came back a year later. Do that with your own revenue projections. Even a rough after-action review teaches you more about your assumptions than a fancier model ever will.
- Two mediocre opinions can beat one good one. You almost certainly already have more than one revenue estimate floating around — the conservative one from finance, the optimistic one from economic development, the gut number from whoever's been there twenty years. Averaging honest, independent guesses isn't a cop-out. This year it would have cut our error by two-thirds.