In our last post of the blog series, we discussed prediction intervals and how they can help your forecasts. While “prediction intervals” may have been new terminology for you, you may have heard the phrase “confidence interval” thrown around before. These aren’t interchangeable; not all intervals answer the same question. In municipal forecasting, confusing confidence intervals with prediction intervals can quietly lead to unrealistic expectations.
In this post, we’ll explain:
- what confidence intervals are;
- how they differ from prediction intervals;
- why prediction intervals are usually the right tool for city forecasting; and
- when confidence intervals can be useful for municipal decision-makers.
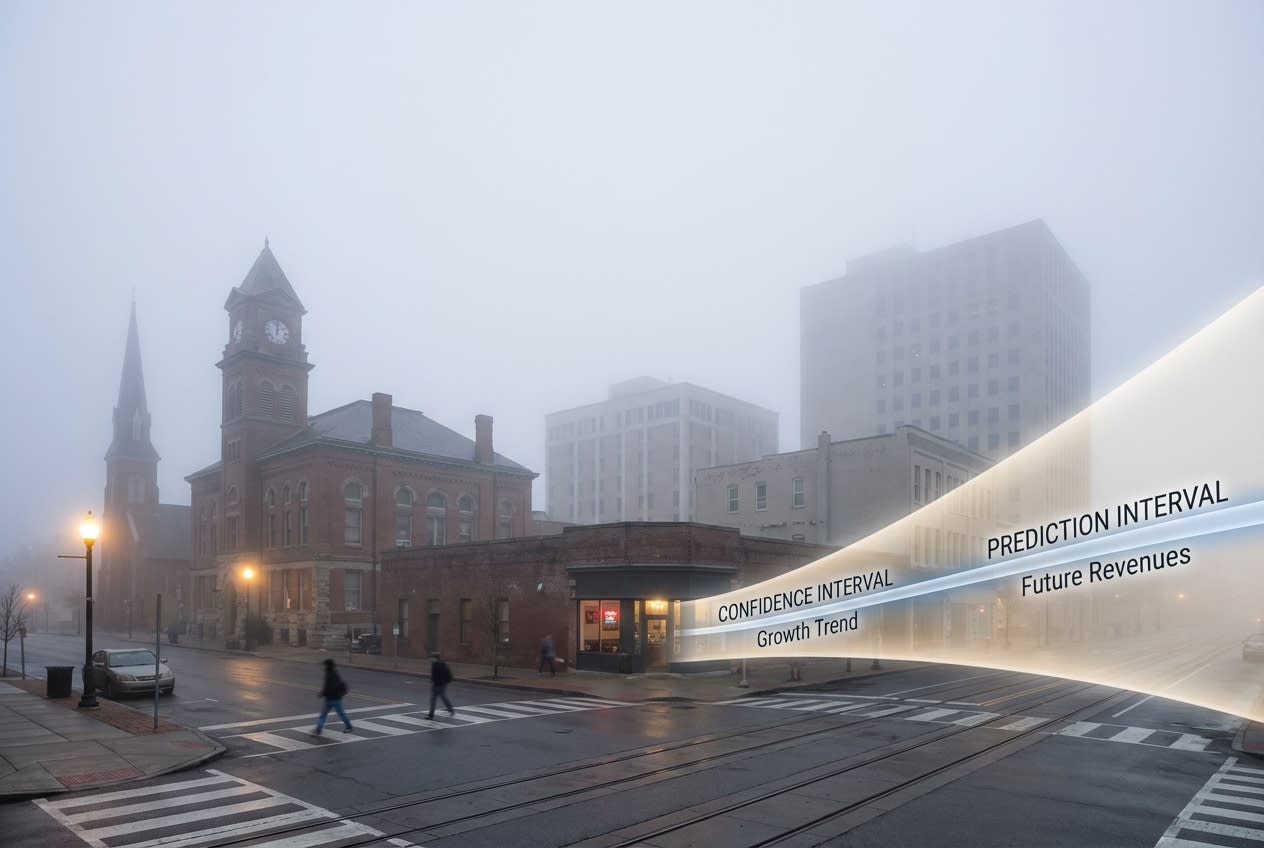
Two kinds of uncertainty, two kinds of intervals
At a high level, cities face two very different types of uncertainty:
Uncertainty about the future itself: “What will next quarter’s sales tax actually be?”
Uncertainty about what we’ve learned from data: “How confident are we in estimated growth rates, trends, or policy effects?”
These correspond to two different statistical tools.
About confidence intervals
A confidence interval (CI) is designed to quantify uncertainty about a fixed but unknown quantity (say, the true long-run growth rate of sales tax revenue), such as:
- a growth rate,
- an average,
- a trend,
- or the effect of a policy change.
For example, we might use confidence intervals when looking at long-run growth of sales tax revenues.
“Based on historical data, we estimate long-run sales tax growth at 3.1%, with a 95% confidence interval from 2.4% to 3.8%.”
Rather than worrying about what next quarter’s revenue will be, CIs help show how precisely we have estimated an underlying parameter.
About prediction intervals
In contrast to CIs, a prediction interval (PI) intends to answer the question, “Given everything we know today, where might the actual future value land?”
For example, we might use prediction intervals for next month’s sales tax revenue projections.
“We expect next quarter’s sales tax revenue to fall between $8.6M and $9.8M.”
This range reflects historical volatility, seasonal variation, and model uncertainty about the future path. Prediction intervals are designed to capture future realized values, which is why they are typically wider than confidence intervals, and, for most operational planning, the more useful of the two.
Why prediction intervals are better for city forecasting
When cities forecast revenues, service demand, or workloads, they are almost always asking questions like:
- How bad could the downside be?
- What number should we budget for?
- What if demand comes in higher than expected?
These are future outcome-focused questions, not parameter questions. Thus, prediction intervals are better suited because they:
- Capture ups and downs, because they reflect historical volatility and seasonal swings,
- Enable contingency planning, because they make downside and upside scenarios explicit,
- Align with municipal risk, because they quantify uncertainty in future outcomes, where shocks and surprises occur.
A common source of confusion
Confidence intervals and prediction intervals are often mixed up because they can look similar on a chart and share familiar percentages like 90% or 95%.
Again, it is important to note their interpretations are fundamentally different:
- A confidence interval answers: “How uncertain is our estimate?”
- A prediction interval answers: “How uncertain is the future data?”
For budgeting, staffing, and service planning, the second question is almost always the one that matters.
So when are confidence intervals useful for cities?
Confidence intervals are still extremely valuable, just in different contexts. Municipal decision-makers often rely on confidence intervals when:
- evaluating the impact of a policy or program;
- estimating long-term growth or decline rates;
- comparing neighborhoods or service outcomes;
- assessing whether observed changes are meaningful or just noise;
- estimating the effect of a tax rate change on revenue;
- assessing whether a redevelopment area is truly growing faster than others; or
- determining whether a negative trend has shifted enough to warrant action.
Notice that in these cases, the question is centered around what we can learn from the data we already have seen. That’s exactly what confidence intervals are designed to answer.
What’s next
In our previous post, we focused on prediction intervals and how they help cities prepare for variability. In our next post, we’ll go one step further, exploring how probability-based simulations extend prediction intervals into full scenario planning, helping cities stress-test decisions across possible futures.
The future won’t follow a single path, and good planning shouldn’t either.