
In today's episode of ZacCast ("The Mo is Slow"), we talked about the continuing trend of slowing sales tax collections across the state of Texas. But since audio isn't always the best format for number talk, we thought it would be a good idea to write up a post for our visual-learning friends and colleagues.
TL;DR - Sales tax has been slowing for some time, and this trend is spreading across the state.
Tracking momentum
")
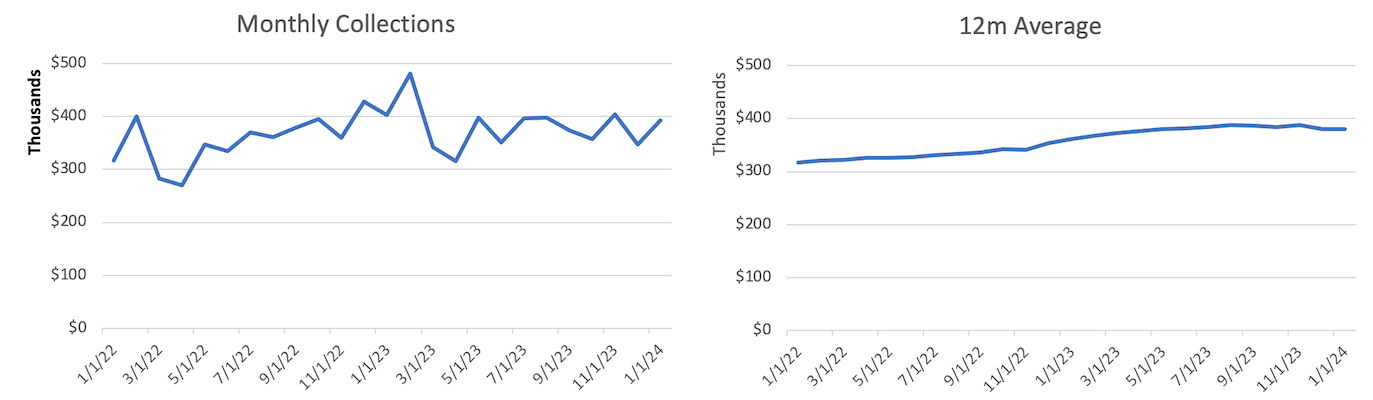
Due to the cyclical nature of sales tax collections, any trend analysis has to involve smoothing out seasonal artifacts. Rolling averages are a common way to do this, and a twelve-month moving average (12ma) is particularly helpful in sales tax since we budget our revenue annually. Consider the two charts below. The monthly collections chart on the left appears to show an increase over the two-year period, but it's much more difficult to suss out than the moving average chart on the right, which smooths out the monthly fluctuations.
Comparing a short-term moving average to a longer-term moving average is a great way to start tracking your sales tax momentum.
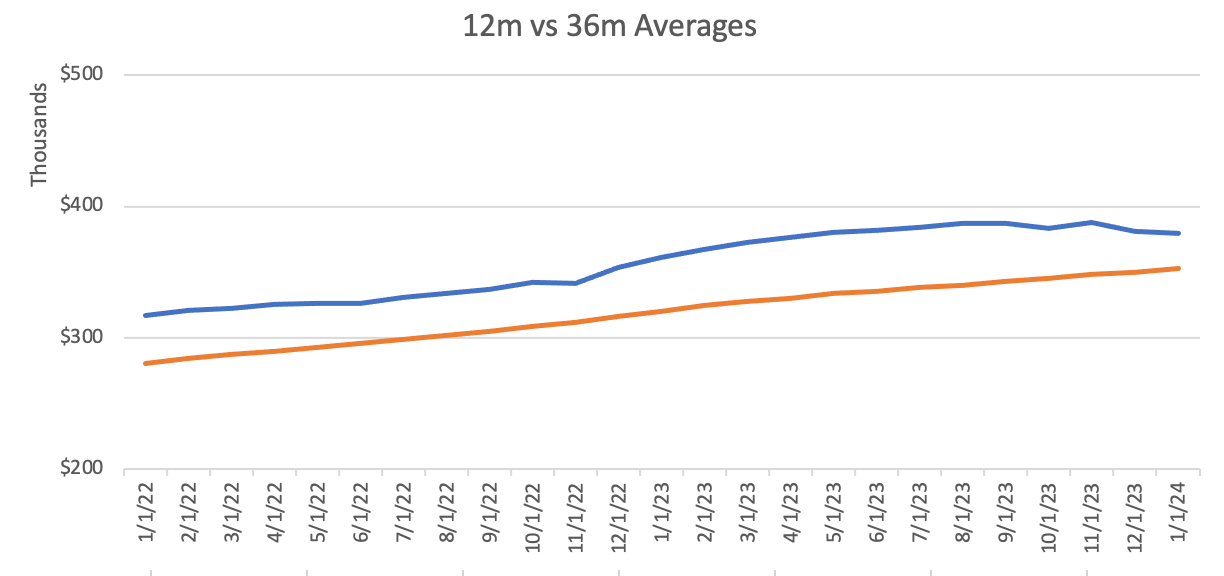
There are a couple of things to look for in this type of chart:
You want the blue line (12m) to be above the orange line (36m) because it means your recent collections are greater than your older collections.
When the 12m is getting farther away from the 36m it means the current trend is increasing. This is good when the 12m is above the 36m, but bad when it's below.
There are two inflection points to watch for: when the 12m crosses below the 36m, that's bad; when the 12m crosses above the 36m, that's good.
This type of analysis is a solid starting point, but it's always going to be a lagging indicator. You definitely don't want to 12m to cross below the 36m, but it's also critical to know when the 12m switches from moving away from the 36m to coming closer to it.
Getting a little more sophisticated with MACD
Moving Average Convergence/Divergence (MACD) is a commonly used indicator in stock trading. Without getting too in the weeds, it's a way to zero in on the strength, direction, and momentum of a stock price by looking at how the short- and long-term moving averages are converging (coming towards) or diverging (spreading apart).
The beauty of MACD is that it is much more sensitive to shifts in momentum. In other words, where the 12m vs 36m analysis has inflection points when the revenue totals flip, MACD has inflection points when they start converging or diverging. This can give you a much more timely indicator that your momentum might be changing, either for the good or the bad.
Consider the following comparison:
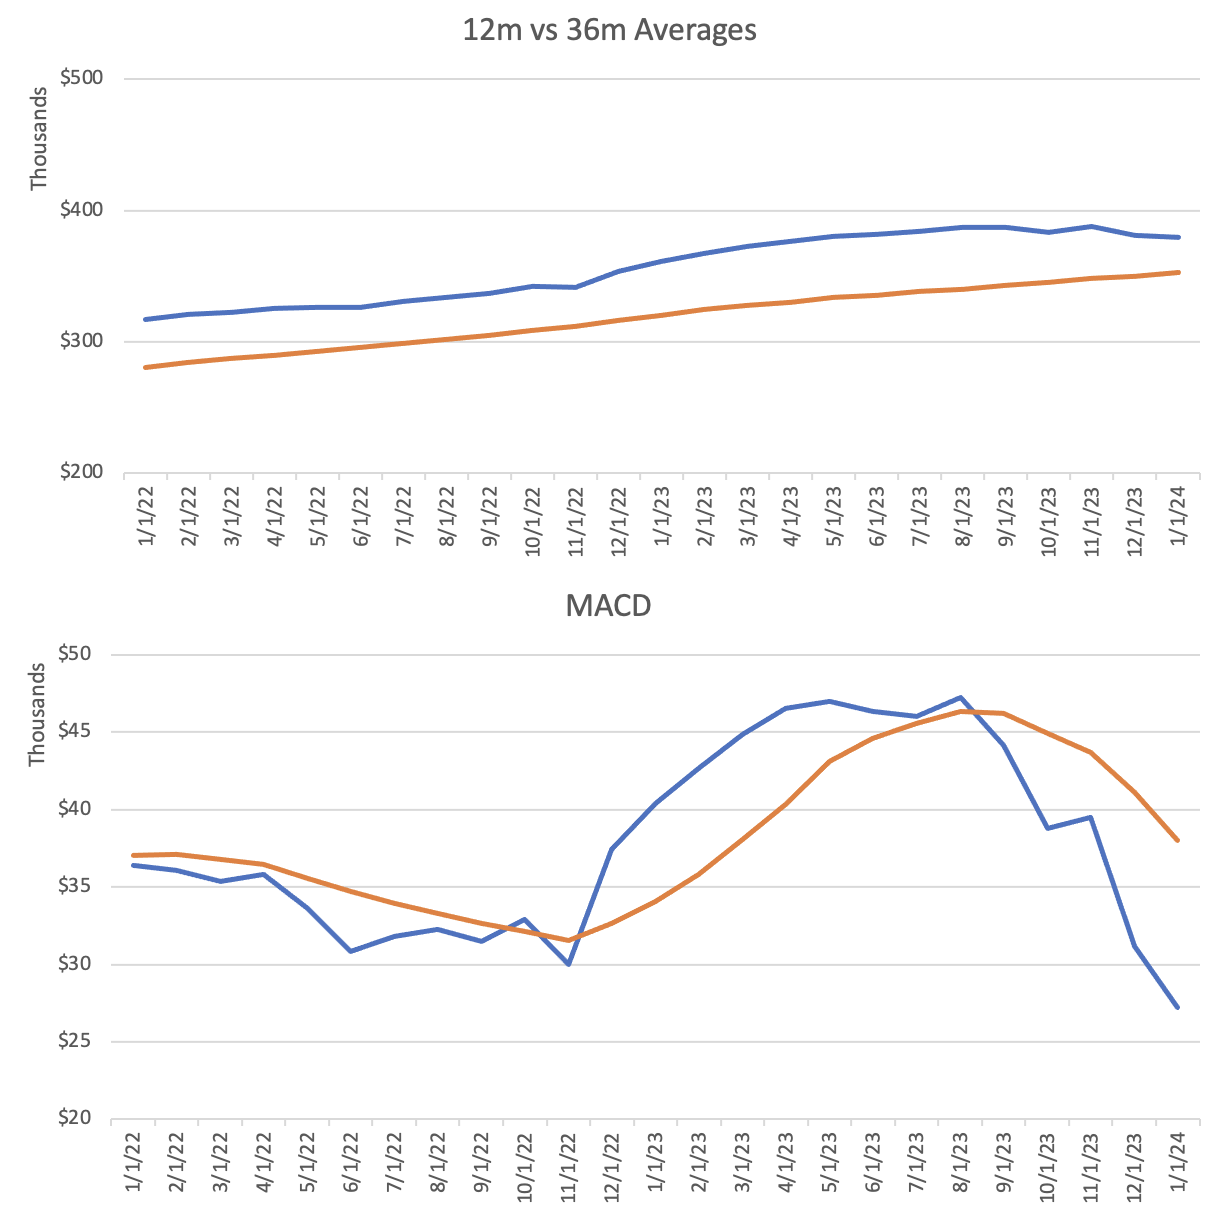
At the top, we have our 12m vs 36m average chart. Below it, the blue line represents the difference between those lines (i.e., [12m] - [36m]), and the orange line represents a 6-month average of that variance.
The inflection points when those lines overlap is the point at which growth (or decline) shifts from increasing to decreasing. The inflection point in August (shown on the MACD chart) tells us that our our 12m average is no longer growing relative to our 36m average.
In other words: Growth is slowing.
And in this case, the trend is continuing. In fact, the gap between the short-term and long-term averages has dropped by nearly 50% in the past 6 months.
Trends across the state
With the basics of this momentum analysis out of the way, let's look at how we're trending across the state. Fortunately for us, local sales tax allocation data is publicly available. Having pulled a bunch of historicals, we can run this momentum analysis for every city and see what's going on.
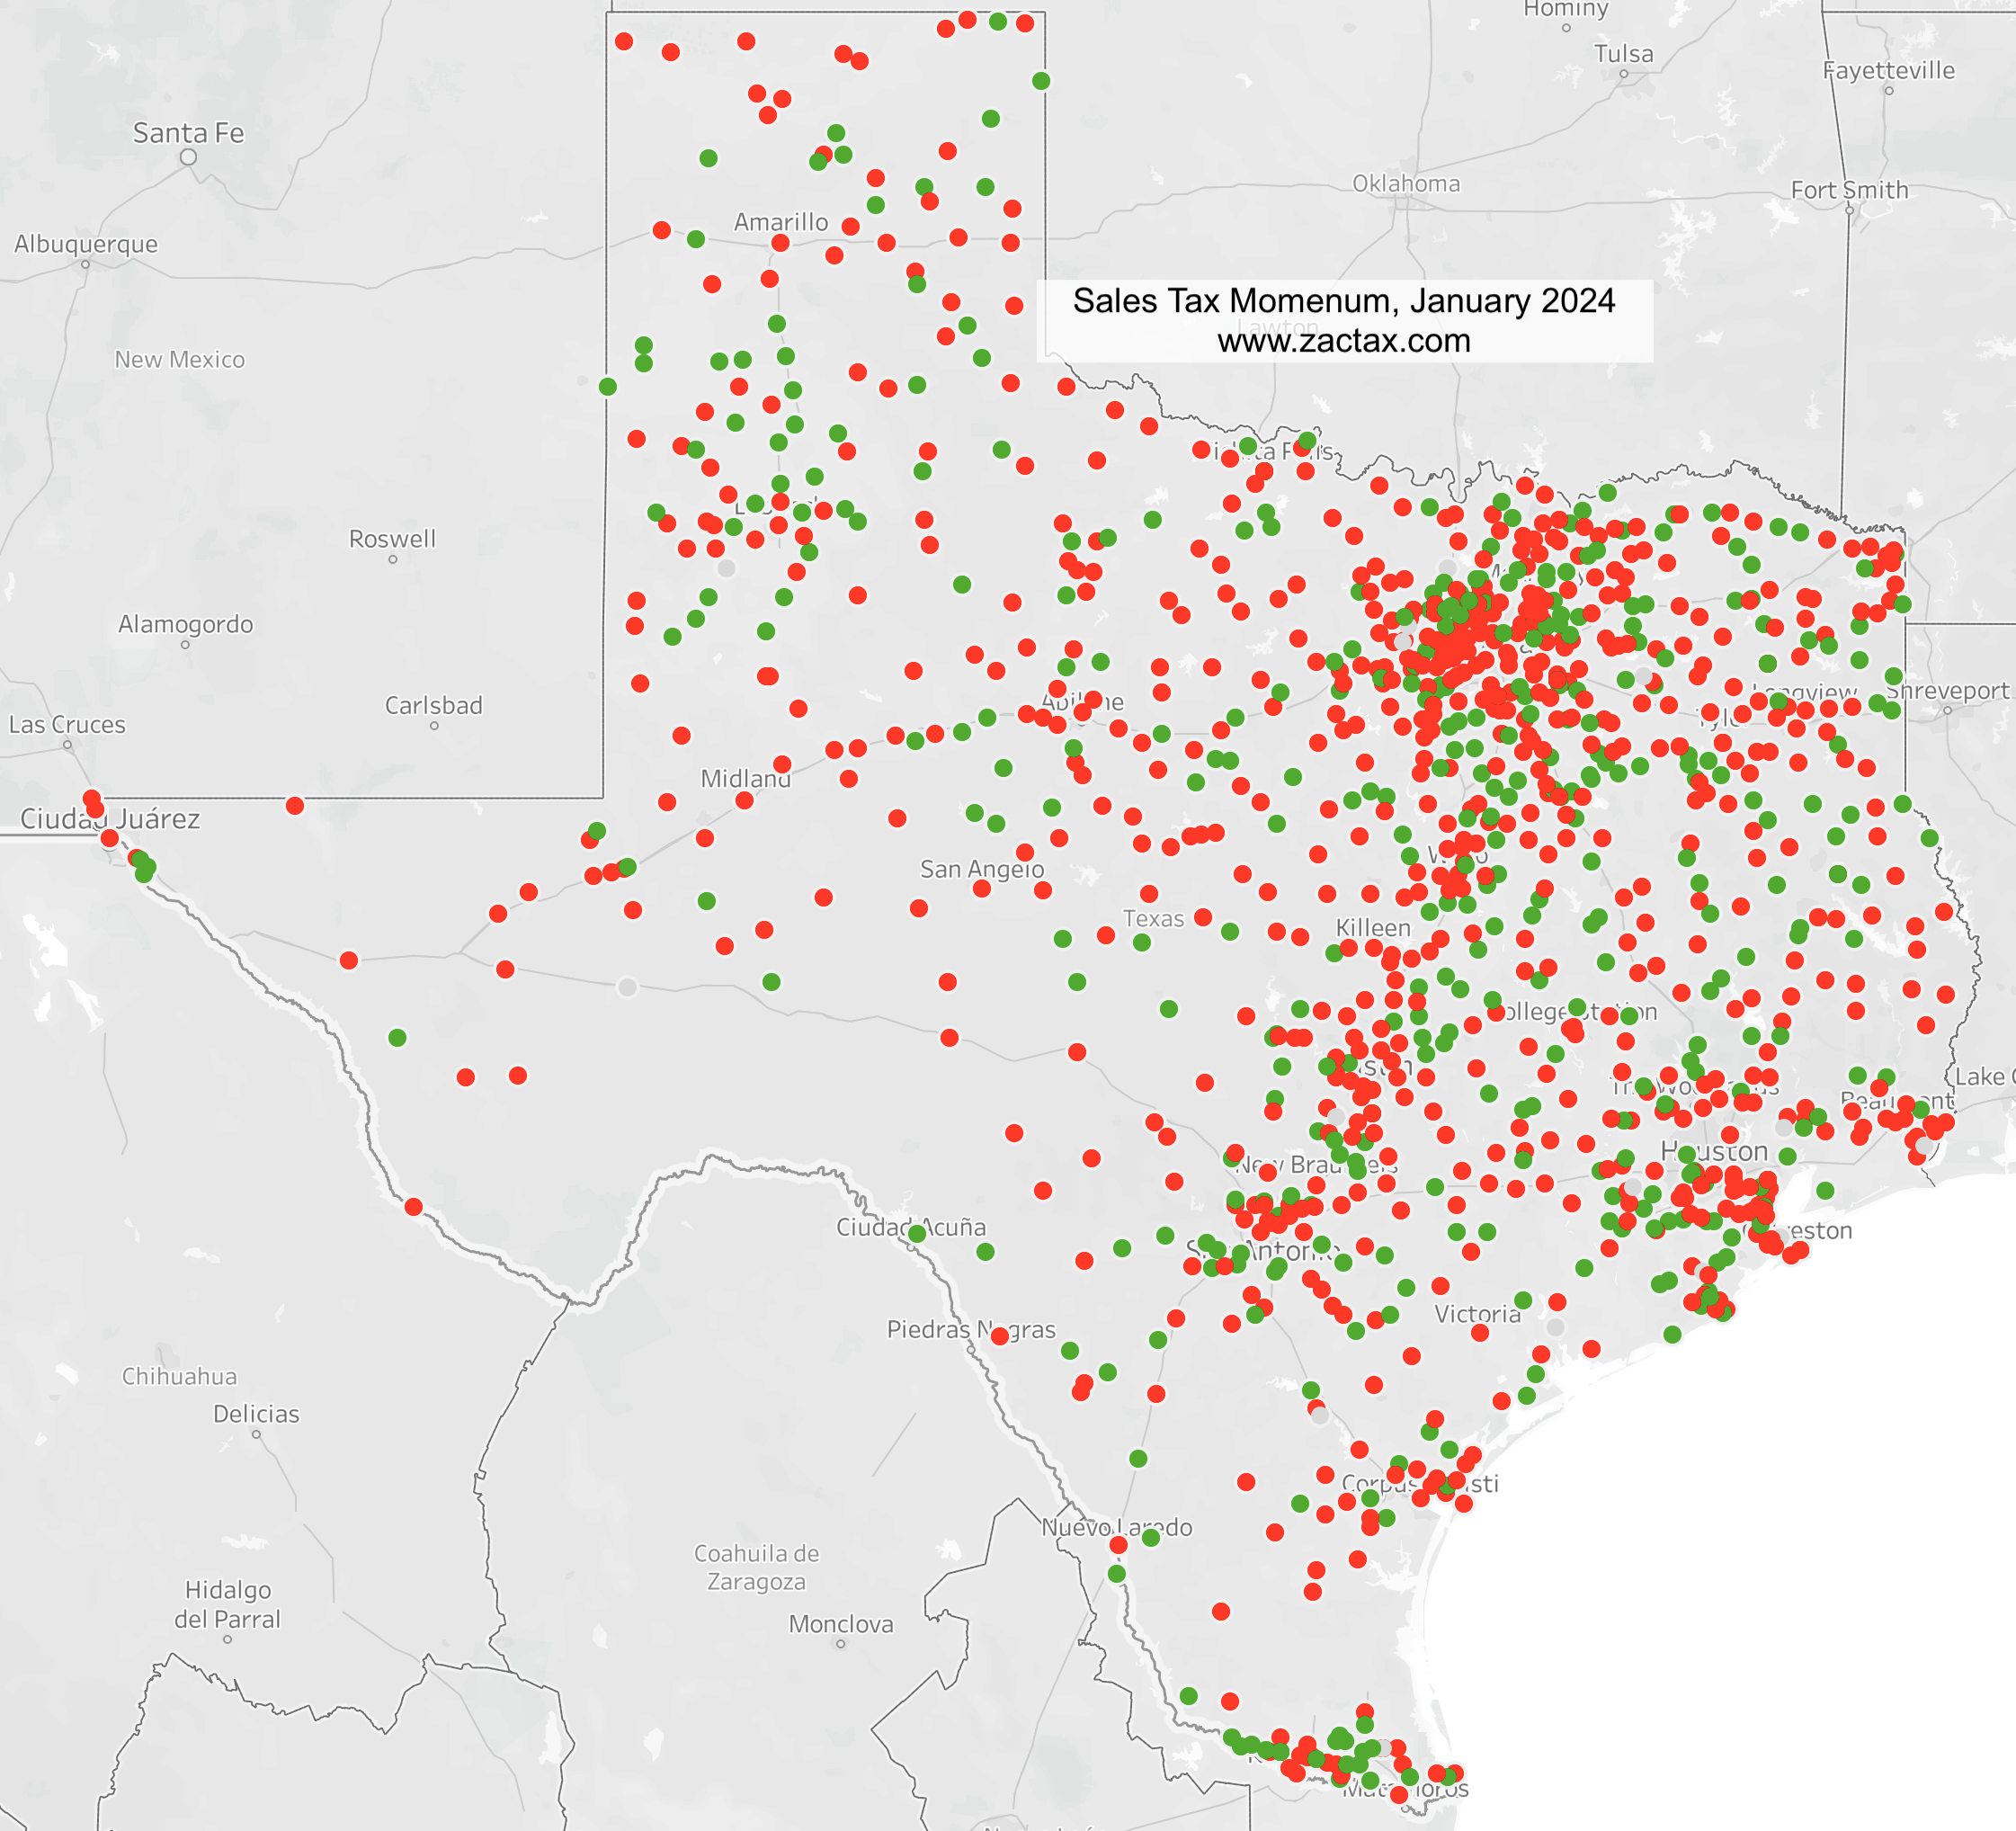
As of January 2024, it's safe to say that momentum is trending down across the state. That's not to say that everyone is experiencing nominal declines in sales tax collections, though! Many cities are still seeing year-over-year increases. What this shows is that the rate of growth is declining across the state.
This is a trend that's been in the works for a while, too. A sample of the highest sales tax producing cities (more than $2.5m in annual allocations), shows that:
57% of those cities had negative momentum for each of the last 6 months;
17% of those cities had negative momentum for most of the last 6 months;
only 10% of those cities experienced continued positive momentum over the past 6 months.
Where do we go from here?
If your city is experiencing declining growth rates, you're not alone. It's happening all over the state, in every metropolitan region, and in cities of all size.
This not to say that your city will experience actual declines in sales tax. It just means that the post-Covid period of rapid sales tax growth is over.
As we move into budget season (and budget amendment season), it's important to understand the sales tax environment we're moving into. Use caution, be reasonable, and use the data you have at your disposal to make good decisions. Good luck!