
While we would love to take credit for what ZacTax has become, the truth is that many of the best features we offer have come from in-depth conversations with our clients. If you look at where we are compared to where we started, the difference is night and day. But our passion for local government extends well beyond revenue analysis. These conversations give us the opportunity to learn in great detail how cities are run across the state of Texas; to benefit from the hard-won wisdom our clients have earned.
We have learned so much from the 130+ cities, counties, and special districts that use ZacTax. So if you don't know, now you know... we love our clients.
Anyway, all this to say that over the past year or two, a recurring theme we've heard revolves around how helpless people feel when it comes to storytelling. Coming up with a solid plan can be easy at times, but governing is harder.
ZacTax has been designed to give public managers the information they need to make good decisions. But once that decision has been made, it needs to be communicated, it needs to be explained, and it requires consensus building around it. And (as we recently wrote about in our September ZacTax Roundup) storytelling can be a great way to do that.
Once you've made your decision, you have to tell your story.
Analysis + Storyboarding
Between the handful of public hints and private conversations, you may be aware that we're working on a Super Top Secret project at the moment. At this point, it's not really even that secret anymore, so rather than building palaces out of paragraphs, here goes: Coming soon to ZacTax, you'll be able to analyze your property tax data as well.
Data rich, and granular to the extreme, property tax analytics has required us to think a bit differently about how ZacTax works. Anyone can dump a bunch of data on your screen; give you fancy widgets to filter, sort, and view things. And to be sure, we've got that, too. In fact, the analytical tools we've built for property tax will allow you to slice and dice your data to your heart's content.
But that isn't going to blow you all away.
With this new project, we decided to focus on storytelling. Not just analytics for its own sake. If you see something on the screen, it should be answering a question that can help tell the story of your data. For example:
- Why has this neighborhood seen steady growth in values, while the one next to it has seen declines?
- How has the character of my city changed over time?
- What parts of our city are the most productive?
- How do the houses we're building today compare to the ones that were built 75 years ago?

Instead of starting with, "What charts can we show?" we started with, "What questions would our users have?" We're substituting, "Oh, this would be cool" with, "Oh, this would help tell a story."
Every neighborhood has a different story, it's own character. A mid-century single family neighborhood has a different story than a late '90s retail center. Is it gentrifying? Is it primed for redevelopment? Is it fiscally sound? Now you'll be able to tell your community's story. And you won't need a full-time GIS department to do it for you!
Storytelling with Sales Tax
This approach has been eye-opening for us. We spend so much of our own time digging into sales tax data, and it's easy to forget that a lot of our users only need ZacTax a couple times a month. They don't look at it every day like us. It's easier for us to see the full story from the raw data, because this is what we do. But our users have more on their plate than just sales tax analysis.
So we're bringing those storytelling concepts over to our flagship sales tax platform as well. We're substituting jargon for plain language; cleverness for straightforwardness; and succinctness for clarity.
We've also spent some time thinking about ways to provide more historical context. You'll find a heavy dose of sparklines throughout ZacTax now to provide inline context.

In other areas, we've added some new charts to provide a better view of how you're performing compared to the past.
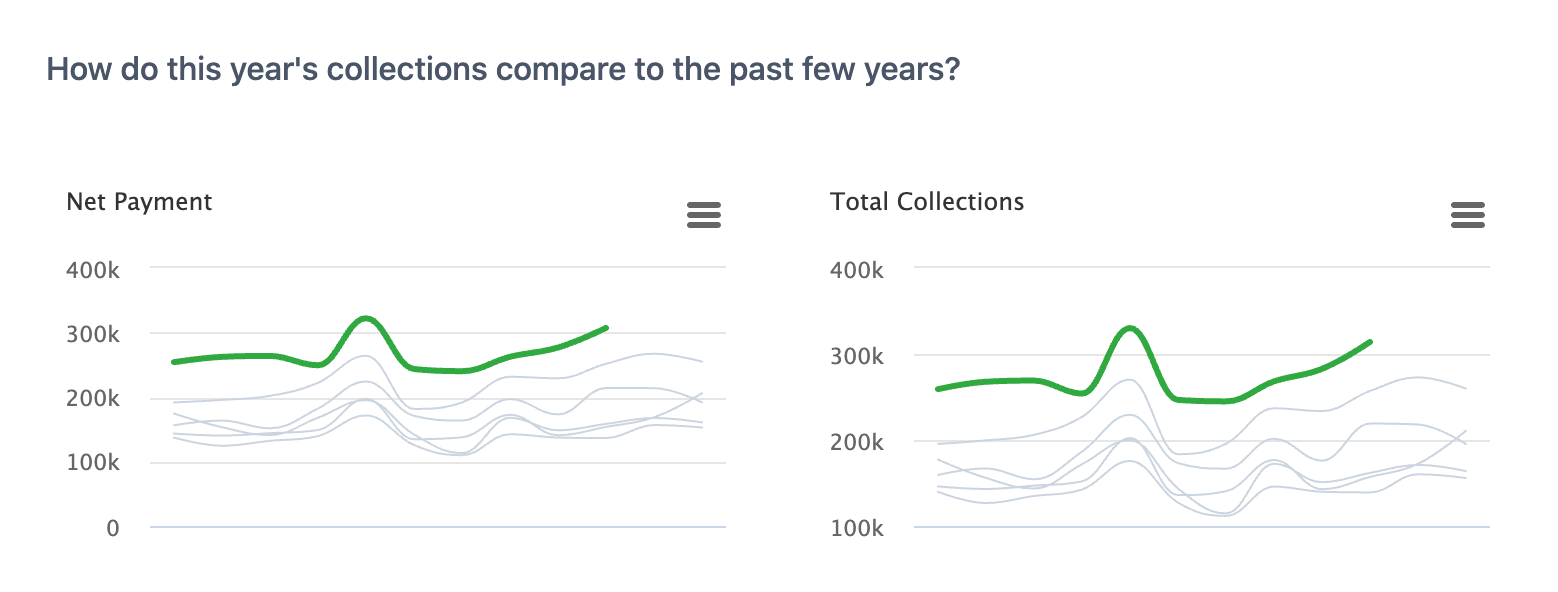
We think you're going to be quite satisfied with your storytelling abilities when we roll these additions out later this year. But like most good things in life, you'll have to wait for it, wait for it.